Analysis
Logpyle is distributed with tools that can assist in analyzing data stored in its sqlite output files.
runalyzer, for analysis taking advantage of powerful SQL queries.
runalyzer-gather, for joining, or gathering, multiple sqlite
files into one.
htmlalyzer, for basic analysis benefiting from a GUI.
Runalyzer
runalyzer is a CLI tool that allows plotting, exporting, and viewing of
data in the form sqlite files exported by logpyle, all using SQL commands.
When running runalyzer without gathering sqlite files together,
runalyzer will auto gather these files together and create an
in memory database as if runalyzer-gather had been run.
SQL mangling is how we reduce our complex SQL schema to a friendly CLI
interface. When referring to a quantity, precede its name with a $, under
the hood, this ensures that the quantity is gathered from all present run_ids.
Note
Mangling is enabled by default. Disable mangling by passing -n/–non-mangled into runalyzer.
Magic refers to the usage of customized commands to operate on our mangled and
non-mangled SQL queries. To issue a magic command, preceding it with a ..
This will issue a command to runalyzer instead of referring to a python symbol.
Running the script
>>> runalyzer log.sqlite
Describing Schema
.constantsShow a list of (constant) run properties
- Parameters:
None
- Ex:
>>> .constants
.quantitiesShow a list of time-dependent quantities
- Parameters:
None
- Ex:
>>> .quantities
.warningsShow a list of warnings
- Parameters:
None
- Ex:
>>> .warnings
.loggingShow a list of logging messages
- Parameters:
None
- Ex:
>>> .logging
Basic Usage
.q SQLExecute a (potentially mangled) query
- Parameters:
SQL
- Ex:
- Grabbing quantities:
>>> .q select $step, $dt
- Grabbing constants:
>>> .q select date, machine
.plot SQLPlot results of (potentially mangled) query. Result sets can be (x, y) or (x, y, descr1, descr2, …), in which case a new plot will be started for each tuple (descr1, descr2, …)
- Parameters:
SQL
- ex:
>>> .plot select $step, $dt
.scatter SQLMake scatterplot results of (potentially mangled) query. Result sets can have between two and four columns for (x, y, size, color).
- Parameters:
SQL
- Ex:
>>> .scatter select $step, $dt
.helpShow a help message
- Parameters:
None
- Ex:
>>> .help
Advanced Features
Plotting multiple runs
Plotting multiple runs by splitting run ids (look into schema)
To print constant run data of multiple runs that have been gathered, run the following command:
>>> db.print_cursor(q("select * from runs"))
With the ids generated at time of gathering for each respective run, you may peel out data from each run or multiple runs by specifying its id(s).
>>> .plot select $step,$dt where id=1
Running this command will plot dt(y) by step(x) from the first run given at time of gathering.
You may also pull out data from multiple runs by relaxing the constant in the where clause.
>>> .plot select $step,$dt where id=1 or id=2
Running this command will plot dt(y) by step(x) from the first two runs given at time of gathering.
Issuing commands to Runalyzer
When running runalyzer, a common use case is to run a single command before exiting. This can be accomplished by issuing the command as a string argument to runalyzer.
>>> runalyzer summary.sqlite --command 'db.print_cursor(db.q("select $t_init.max"))'
When the user requires multiple commands to be issued, In order to support issuing multiple commands, runalyzer allows the user to pass in a script to be executed after loading the database.
# script.py

db.print_cursor(db.q("select * from warnings"))
db.print_cursor(db.q("select * from logging"))
>>> runalyzer summary.sqlite --script script.py
Runalyzer-gather
runalyzer-gather takes in sqlite files from logpyle and combines them
all into a single sqlite summary file readable by runalyzer.
This serves as a great method of combining distributed-memory runs together for storage and analysis without needing to keep track of many non-centralized files. Additionally, preserving all run data in a single file is greatly beneficial to any version control system.
Running the script
>>> runalyzer-gather summary.sqlite log.sqlite
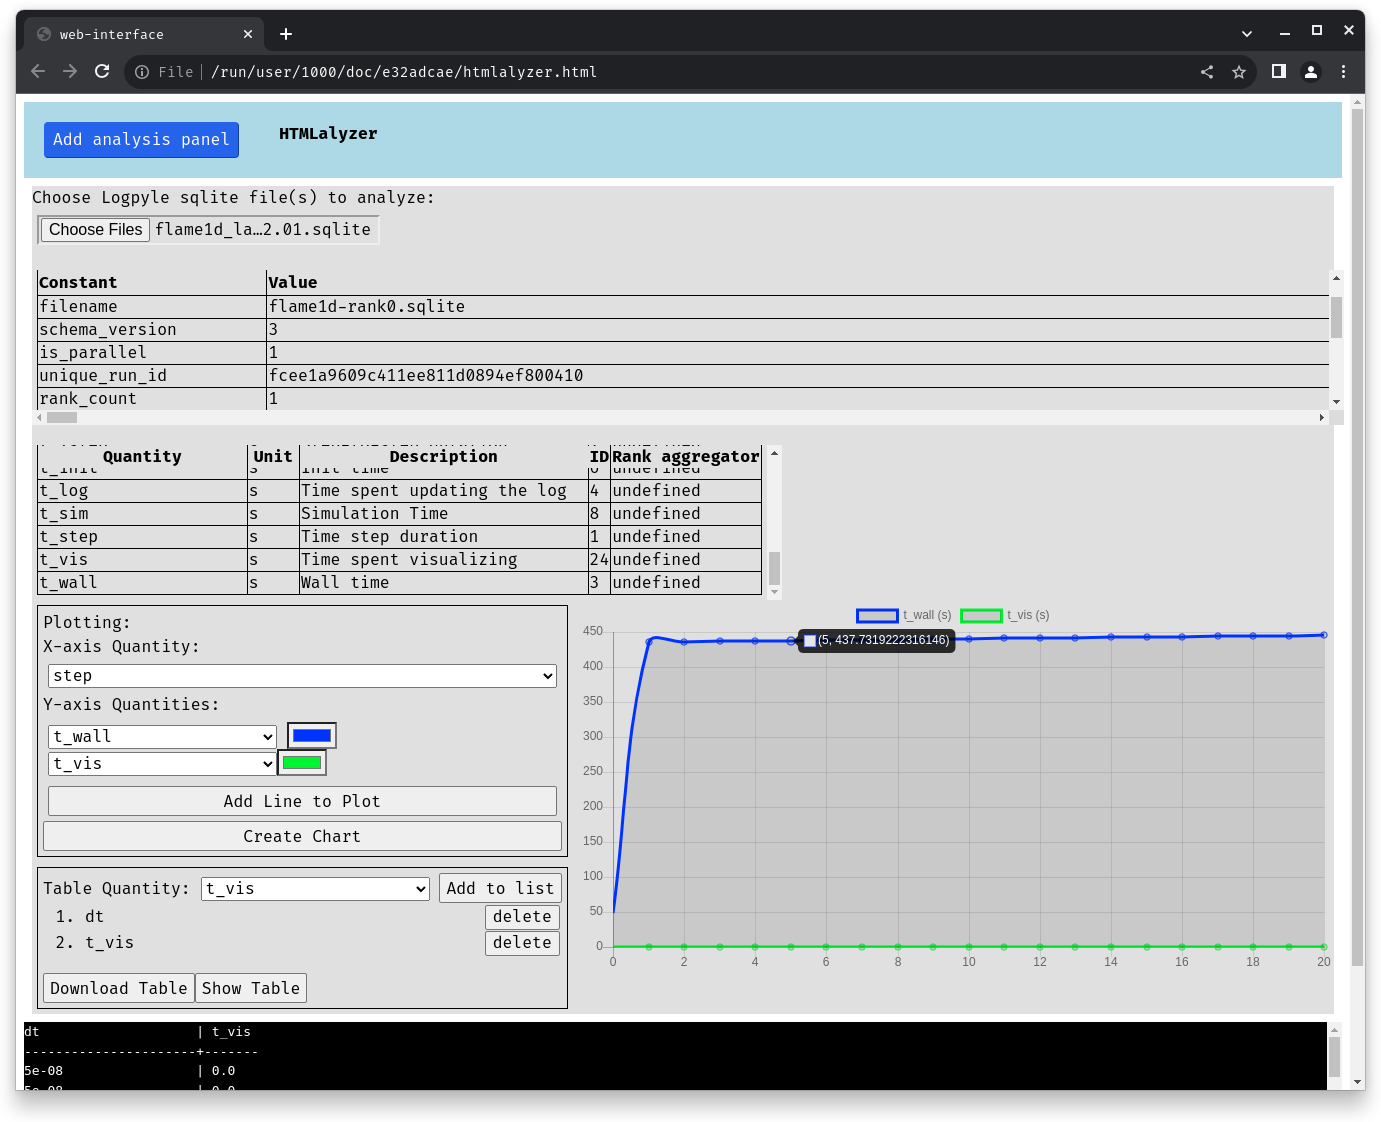
HTMLalyzer
htmlalyzer is a GUI for quickly analyzing files logpyle sqlite files. It
features plotting multiple quantities together and analyzing multiple runs
at the same time.
HTMLalyzer uses PyScript, a framework that runs python in the browser and runs Pyodide, CPython compiled to WebAssembly.
Running the script
>>> htmlalyzer
This will attempt to open a new tab in your default browser allowing you to upload sqlite files to be analyzed.
passing in the --build flag will rebuild the HTML file
before serving it.
Usage
After the virtual environment has been setup, click the Add file button
to add a panel for analysis.
To analyze a run, click on the browse button to upload one or more files.
These files will be gathered together under the hood. You can then select
quantities from the X and Y dropdowns. If you would like to keep track of
multiple quantities in the same graph, you can press Add Line to Plot
to add a Y dropdown.
The output chart is interactive. Hovering over points will display floating point values, and you can toggle lines by clicking their name in the legend.
Any stdout from python will display in the terminal below any of the panels.